How to Measure Emotional Engagement: A Data-Driven Approach
Learn practical methods for measuring emotional engagement in brand experiences. From facial analysis to behavioral signals, discover the tools and techniques that reveal true customer feelings.


How to Measure Emotional Engagement: A Data-Driven Approach
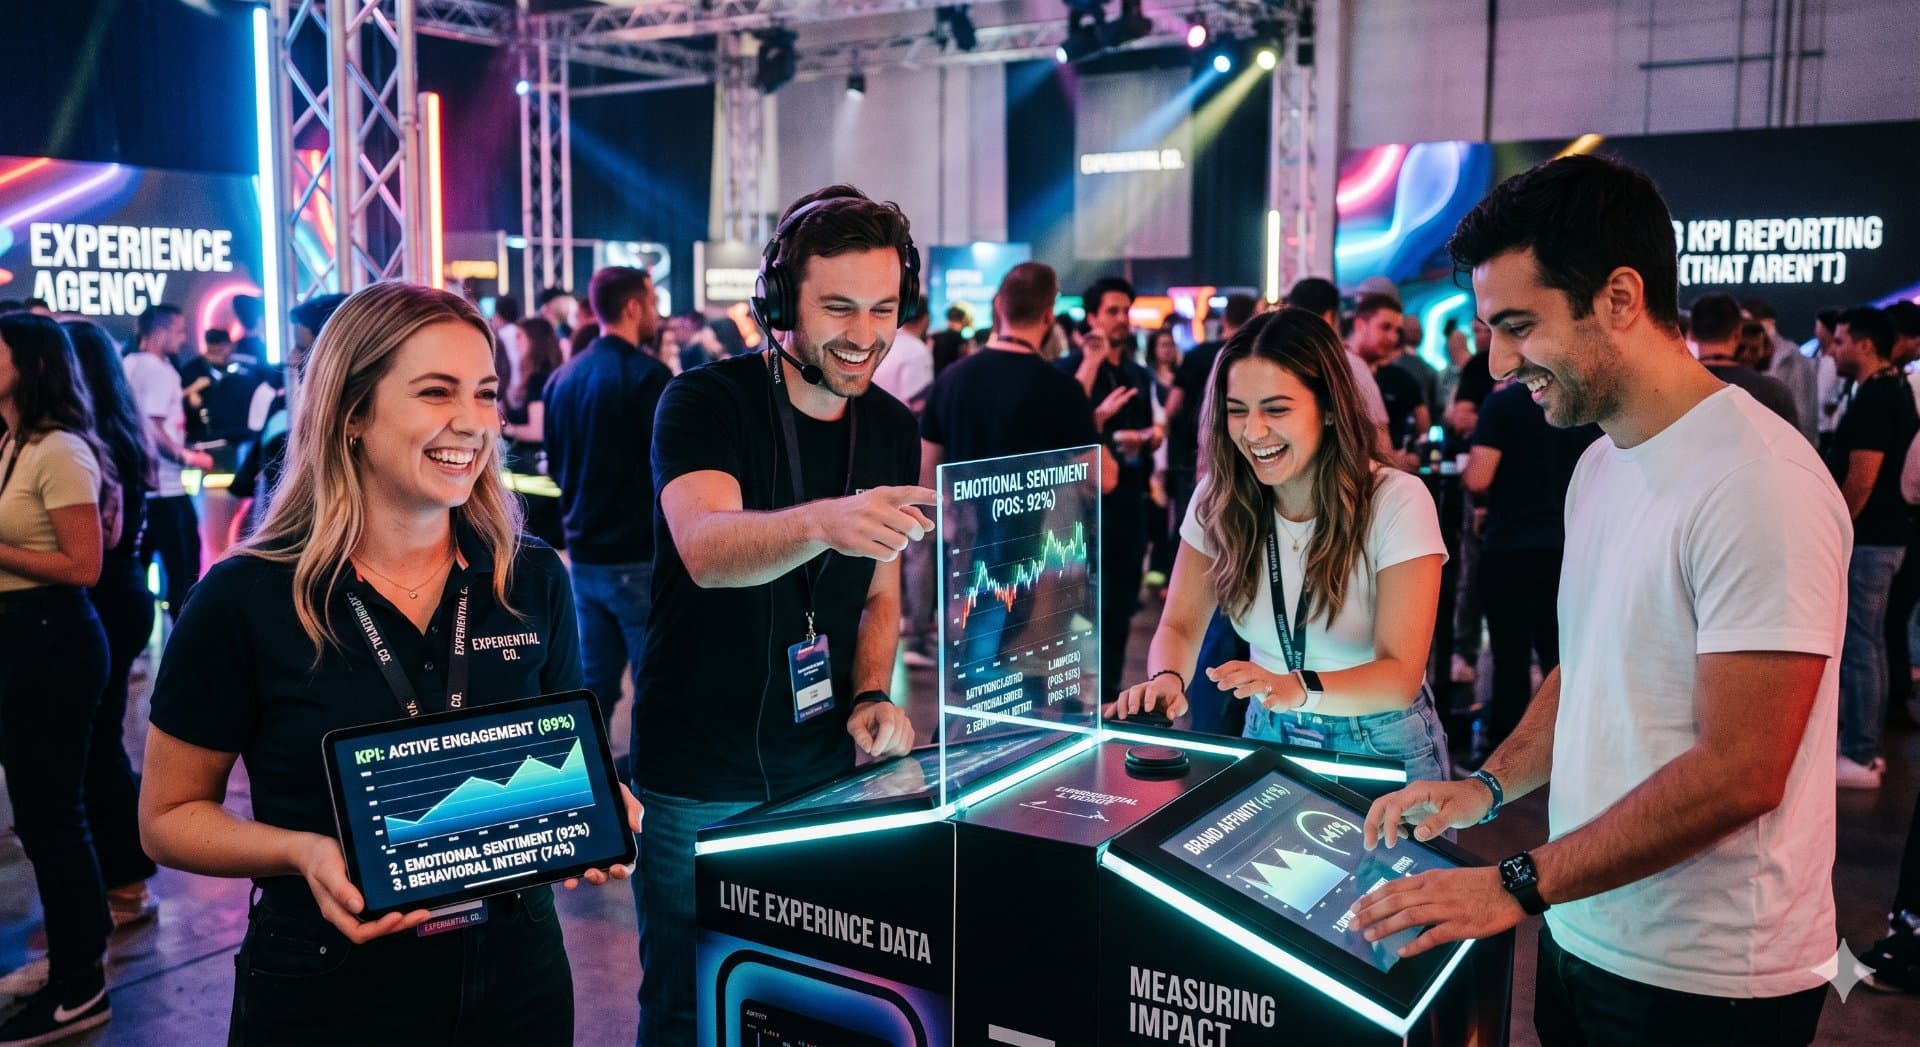
Measuring emotional engagement has evolved from guesswork to structured methodology. But not all approaches are equal — and not all are practical for experiential marketing at scale. This guide explores the landscape of emotional measurement, distinguishes between lab-grade techniques and experience-native signals, and explains how teams can measure what matters most: how people feel.
The Challenge of Measuring Emotions
Traditional metrics like foot traffic, dwell time, and conversion rates tell only part of the story. They reveal behavior but not motivation. Two visitors might spend the same amount of time at your experience, but one leaves delighted while the other leaves frustrated.
Why Traditional Metrics Fall Short
- Surveys are retrospective — Memories of emotions differ from actual emotions
- Behavioral data is ambiguous — The same behavior can stem from different emotions
- Self-reporting is biased — People often don't know or won't share how they truly feel
Emotional Measurement: The Broader Landscape
The field of emotional measurement includes a range of techniques. Some are well suited to controlled research environments. Others are designed for live, scalable experiences. Understanding the distinction matters.
Lab-Grade and Research Methods
These approaches exist in the broader emotional measurement category. They are used in academic, clinical, and controlled research settings — but they are not what most experiential teams deploy in the field.
Facial expression analysis uses camera-based systems to detect micro-expressions tied to emotional states. It requires camera access, consent, controlled lighting, and is best suited to research environments.
Voice and speech analysis captures emotional signals through tone, pitch, pace, and hesitation patterns. It can be effective in structured conversations but is sensitive to background noise and context.
Biometric measurement includes physiological signals like heart rate variability (HRV), galvanic skin response (GSR), and eye tracking. These require wearable devices or specialized equipment, making them impractical for most live activations.
These methods have value in controlled settings. However, they introduce friction, require hardware, and raise significant privacy and consent challenges when applied to experiential marketing at scale.
Experience-Native Signals: Ether's Approach
Ether takes a fundamentally different approach. Instead of attaching sensors to people or analyzing biometric data, Ether interprets emotional response from signals that already exist inside the experience itself.
What are experience-native signals?
They are the behavioral and interaction patterns that naturally emerge when people engage with an experience:
- Interaction patterns and sequences — What people choose to do, and in what order
- Engagement depth and duration — How deeply people engage with specific moments
- Choice and decision patterns — What people select, skip, or return to
- Participation quality — How people respond to prompts, gameplay, or interactive elements
- Sharing and social behavior — Whether people share, screenshot, or invite others
These signals do not require cameras, wearables, or any hardware beyond the experience itself. They are captured passively, without disrupting the moment.
Why this matters:
Experience-native signals scale. They work across digital, live, and hybrid environments. They do not require consent for biometric data collection. And they can be collected continuously, allowing teams to compare experiences over time.
Building an Emotional Measurement Framework
Step 1: Define Your Emotional KPIs
Not all emotions matter equally for your objectives. Define:
- Primary signals — The core responses you want to detect (attention, relevance, motivation)
- Secondary signals — Supporting emotional patterns (curiosity, delight, trust)
- Risk signals — What you want to minimize (frustration, confusion, disengagement)
Step 2: Map Measurement Points
Identify where emotional measurement adds the most value:
- Entry points — Baseline emotional state
- Peak moments — Designed emotional highlights
- Transition points — Between experience phases
- Exit points — Final emotional impression
Step 3: Match Method to Context
Different environments call for different approaches:
| Context | Practical Approach |
|---|---|
| Live events | Experience-native interaction signals, real-time feedback |
| Digital experiences | Behavioral analytics, choice and engagement patterns |
| Retail environments | Dwell and interaction patterns, participation quality |
| Hybrid activations | Combined digital and physical interaction signals |
Step 4: Interpret Signals as Insight
Raw signals become useful when interpreted through an emotional lens:
- Connect interaction patterns to emotional response dimensions (attention, memory, intent)
- Compare signal patterns across experiences to identify what resonates
- Track emotional patterns over time to build compounding insight
Analyzing Emotional Data
Emotional Journey Mapping
Plot emotional intensity across the experience timeline:
- Identify emotional peaks and valleys
- Compare intended vs. actual emotional journey
- Find correlation between emotional signals and downstream behavior
- Optimize low-performing moments
Segmentation by Emotional Response
Group participants by their emotional patterns:
- Engaged — High positive response throughout
- Curious — Moderate engagement with exploration patterns
- Converts — Low-to-high engagement journey
- Disengaged — Low response or early exit patterns
Connecting Emotion to Business Outcomes
Use emotional signal data to understand:
- Which experience elements drive the strongest emotional response
- What emotional patterns correlate with intent to act
- How to refine experiences based on response, not just participation
Common Measurement Pitfalls
- Measuring too much — Focus on actionable signals, not data volume
- Ignoring context — Emotions vary by situation and environment
- Over-relying on one method — Combine signal sources for confidence
- Forgetting the baseline — Always compare to starting state
- Delayed analysis — Timely insight enables timely optimization
Privacy and Practical Considerations
Emotional measurement requires responsible practices:
- Transparency — Clearly communicate what you are measuring
- Minimal friction — Avoid methods that disrupt the experience
- Anonymization — Protect individual privacy in analysis
- Purpose limitation — Use data only for stated purposes
- Scalability — Choose methods that work across environments without specialized hardware
Conclusion
Measuring emotional engagement does not require attaching sensors to people. It requires interpreting the signals that experiences already produce.
By focusing on experience-native signals — interaction patterns, engagement depth, choice behavior, and participation quality — teams can measure emotional response at scale, without friction, and with insight that stands up to scrutiny.
The key is starting with what the experience already tells you, and building measurement confidence from there.
Related Articles

What Is Emotion Intelligence in Marketing?
Emotion Intelligence is the capability to measure emotional response during brand experiences and translate it into defensible business insight. Learn what it is, how it works, and why it matters for experiential marketing.
The 5 KPIs Every Experiential Agency Should Be Reporting (That Most Aren't)
Most experiential agencies report on foot traffic and impressions. The agencies that keep their clients report on these 5 KPIs instead — and they're the ones that survive budget reviews.

How Agencies Prove Experiential ROI to Clients Without Relying on Foot Traffic
Foot traffic and impressions don't prove experiential ROI. Learn how leading agencies use Emotion Intelligence to deliver defensible activation measurement that keeps clients investing.
Interested in implementing this for your brand?